Finding the right AI data analysis tools can feel like searching for a needle in a digital haystack. With countless options promising to transform your data into actionable insights, how do you separate the game-changers from the time-wasters?
As an AI engineer who’s spent years testing these tools, I’ve witnessed firsthand how the right solution can turn overwhelming spreadsheets into clear business decisions.
In this article, we’ll review the top picks to help you choose the perfect AI-powered data analysis companion for your specific needs in the current AI landscape.
Why AI is a Game Changer for Data Analysis in 2026
Remember when data analysis meant spending hours manually cleaning spreadsheets and building basic charts?
Those days are thankfully behind us. AI has revolutionized how we approach data, automating tedious tasks and uncovering insights that would take humans days or weeks to discover.
In 2026, AI data analysis tools have evolved beyond simple automation. They now understand natural language, allowing you to simply ask questions about your data and receive instant answers. They can identify patterns across massive datasets, predict future trends with remarkable accuracy, and even suggest actions based on those insights.
What truly makes these tools game-changing is their accessibility. You no longer need a data science degree to extract value from your information. Modern AI tools have democratized data analysis, bringing powerful capabilities to everyone from marketing managers to small business owners.
The best solutions combine sophisticated algorithms with intuitive interfaces, turning complex data into clear visualizations and actionable recommendations.
How I Tested and Ranked These AI Data Analysis Tools
To ensure this review provides genuine value, I personally tested each tool using real-world business datasets. My evaluation focused on six key criteria that matter most to actual users:
- Feature Set: Does the tool offer comprehensive analysis capabilities, visualization options, and AI-powered insights?
- Ease of Use: Can non-technical users navigate the interface and extract insights without extensive training?
- Performance: How quickly and accurately does the tool process data and generate results?
- Integration Capabilities: Does it connect seamlessly with common data sources and other business tools?
- Support & Documentation: Is help readily available when users encounter issues?
- Pricing & Value: Does the tool deliver sufficient value relative to its cost?
I also analyzed user reviews from platforms like G2, Trustpilot, and Capterra to incorporate broader perspectives beyond my own testing experience. This combination of hands-on evaluation and community feedback provides a well-rounded assessment of each tool’s strengths and limitations.
Why Should You Trust Me?
You might be wondering why my opinion on these tools matters. I’m an AI Engineer with an MSc in Data Science and Machine Learning and a BSc in Software Engineering. I’ve been working professionally in the field since 2018, ghost-developing numerous AI applications for clients across industries.
My experience spans the entire AI development lifecycle…from data collection and preprocessing to model development and deployment. I’ve worked with organizations ranging from startups to enterprises, helping them leverage AI to solve real business problems. This hands-on experience gives me unique insight into what makes an AI data analysis tool truly valuable versus what’s just marketing hype.
Most importantly, I understand both the technical underpinnings of these tools and the practical needs of business users. This allows me to evaluate not just how advanced the AI is, but how effectively it delivers actionable insights to the people who need them.
AI Data Analysis Tools Comparison Chart
| Tool | Best For | Key Features | Overall Rating | Pricing |
|---|---|---|---|---|
| Powerdrill AI | Quick insights from any data file without coding | Auto data cleaning (Excel/CSV/PDF), chat queries, deep trend analysis, Nano Banana Pro for instant professional slides + visuals, predictive insights, shareable stories | 4.8/5 | Free tier, $4-30/month |
| Julius AI | Business users needing conversational data analysis | Natural language questions on files/databases, instant charts + forecasting, Python/R/SQL modes, learns your business, Slack agent for reports, multiple datasets at once | 4.7/5 | Free tier, $20-45/month |
| Databox | Teams needing unified dashboards from multiple sources | Real-time multi-source integration, AI performance summaries + recommendations, goal tracking, easy reports/sharing, generative AI for plain-English explanations | 4.6/5 | $159-799/month |
| Fabi.ai | Data teams combining SQL, Python and AI | AI-generated SQL/Python code, connects files + databases, automated workflows/dashboards, code editing + team collab | 4.5/5 | Free tier, $39+/month |
| Windsor.AI | Marketers connecting multiple data sources | No-code pipelines, 100+ connectors (marketing/sales tools), auto sync to Sheets/BI, quick setup | 4.4/5 | $19-499/month |
| SciSpace | Researchers analyzing scientific literature | PDF/paper chat + summaries, extract insights/citations, literature search, research-focused Q&A | 4.3/5 | Free tier, $12-20/month |
| Otio | Research and long-form content analysis | Collect/organize sources, AI summaries + notes, writing help, full research workflows | 4.3/5 | Free tier, $10-36/month |
| MaxAI | Browser-based data analysis and explanations | In-browser chat/explain any data/web content, quick summaries, simple integrations | 4.2/5 | Free tier, $12-30/month |
| Pdf.AI | Extracting and analyzing data from PDFs | Chat directly with PDFs, pull tables/text, Q&A + summaries on content | 4.1/5 | Free tier, $10-30/month |
| Krater AI | All-in-one AI access with data capabilities | Multi-AI models/personas (like Data Dan), general chat + basic analysis, broad integrations | 4.0/5 | Free tier, $9-399/month |
Top 3 AI Data Analysis Tools at a Glance

🥇
Powerdrill AI
The ultimate chat-with-your-data solution that processes information up to 100x faster than traditional methods, with no coding required.

🥈
Julius AI
Your personal AI data analyst that learns your business logic over time and integrates directly with your team’s Slack workspace.

🥉
Databox
Comprehensive business intelligence with unlimited users and dashboards, featuring 130+ integrations and powerful AI insights.
1. Powerdrill AI: Chat With Your Data, No Coding Required

Powerdrill AI stands out as the most intuitive data analysis tool I’ve tested. It transforms how you interact with data by allowing you to simply upload files and ask questions in plain English…no SQL queries or coding required.
Whether you’re analyzing customer behavior or forecasting sales trends, Powerdrill delivers insights in seconds rather than hours.
4.8
OVERALL RATING
Key Pain Points Powerdrill AI Solves
Highlight Features
Real-World Success
“ Effortless Data Insights with Powerdrill AI — No Coding Needed, Smooth with Large Datasets
The best thing that I like in Powerdrill AI is how easy it makes while working with data. Even the user is not a data expert, but with Powerdrill, one can upload the data and just start chatting no need of any coding. Not exaggerating but it is like almost talking to your data and getting insights, charts, visuals.
What really stands out is how easy it was to get started. No complicated setup, no coding, just upload your files and start asking questions. I almost use it daily, whether for insights, preparing presentations, and for guidance with the data. I also like and appreciate that how it handles the large datasets smoothly. No lags or crashes like other tools and AIs I’ve tried.
The integration with common formats like Excel and SQL is easy, and it fits right into my workflow without needing extra tools.
Overall, it just makes working with data a lot faster and smarter, which I really enjoy.”
— SRP, ProductHunt, Data Analyst
User Experience
Using Powerdrill feels remarkably intuitive. After uploading your data (In whatever format you choose), you’re presented with a clean chat interface where you can start asking questions immediately. The AI responds with both textual explanations and visual representations of the data.
What impressed me most during testing was how it handled follow-up questions, maintaining context from previous queries to deliver increasingly refined insights. The learning curve is practically non-existent—if you can ask a question, you can analyze data with Powerdrill.
Pros and Cons


Integrations and Support
Powerdrill integrates seamlessly with popular data storage platforms including Google Drive, Dropbox, and OneDrive. It also connects directly to common databases like MySQL, PostgreSQL, and MongoDB. The support team is highly responsive, typically answering queries within hours through chat and email.
Their knowledge base is comprehensive, with detailed tutorials and use cases that help users maximize the tool’s capabilities. Based on G2 and Trustpilot reviews, users consistently rate their support experience above 4.7/5.
Pricing
Powerdrill offers a generous free tier that includes limited storage (up to 100MB) and 50 monthly prompts—perfect for individuals or small teams testing the waters.
Paid plans start at $4/month for the Basic plan (1GB storage, 500 prompts), $10/month for the Plus plan (5GB storage, unlimited prompts), and $30/month for the Pro plan (20GB storage, unlimited prompts, advanced features). All plans offer annual discounts of approximately 20%, making this one of the most affordable AI data analysis tools on the market.
transform your data analysis workflow!
Experience the power of conversational data analysis with Powerdrill AI’s free tier—no credit card required.
2. Julius AI: Your Personal AI Data Analyst

Julius AI has earned its second-place ranking by effectively functioning as your personal data analyst on demand. Purpose-built specifically for business data (unlike general AI tools), Julius excels at understanding financial metrics, marketing KPIs, and operational data through a conversational interface that feels remarkably human.
4.7
OVERALL RATING
Key Pain Points Julius AI Solves
Highlight Features
Real-World Success
“ Julius.ai completely changed how I approach growth. I can analyze multiple datasets at once and turn them into insights for customer acquisition, retention, and marketing campaigns, all without waiting on engineering or hiring data analysts. I’ve used it at two companies now, and it’s saved us hours while helping us make smarter decisions every day.”
— Ami Gosalia, Head of Growth, HomeFromCollege
User Experience
Julius AI offers one of the most natural conversational experiences I’ve encountered in data analysis tools. The interface is clean and focused, with a chat window that accepts complex queries and follow-up questions. What sets Julius apart is its ability to understand business context—it recognizes industry-specific terminology and metrics without extensive training.
During testing, I was particularly impressed by how it handled ambiguous requests, asking clarifying questions rather than making assumptions. The learning curve is minimal for business users, though connecting data sources requires some initial setup.
Pros and Cons
Integrations and Support
Julius AI excels in integration capabilities, connecting directly with major database platforms (PostgreSQL, BigQuery, Snowflake, MySQL) and business tools (Slack, Microsoft Teams, Google Workspace).
The support team provides personalized onboarding for teams on higher-tier plans, with responsive chat support available to all users. Their documentation is comprehensive and includes industry-specific use cases.
User reviews on G2 and Capterra consistently praise their support team’s knowledge and responsiveness, with an average support rating of 4.8/5.
Pricing
Julius AI offers a free tier with limited messages (100/month) and basic features—sufficient for individual users to test the platform. The Plus plan ($20/month with annual billing, $35/month monthly) includes unlimited messages, multiple data sources, and Slack integration.
The Pro plan ($45/month) adds advanced features like scheduled reports, custom templates, and priority support. Enterprise plans with dedicated support and custom integrations are available by quote
Transform your business data into actionable insights!
Start asking questions about your data and get immediate answers with Julius AI’s free tier.
3. Databox: Unified Dashboards with AI-Powered Insights
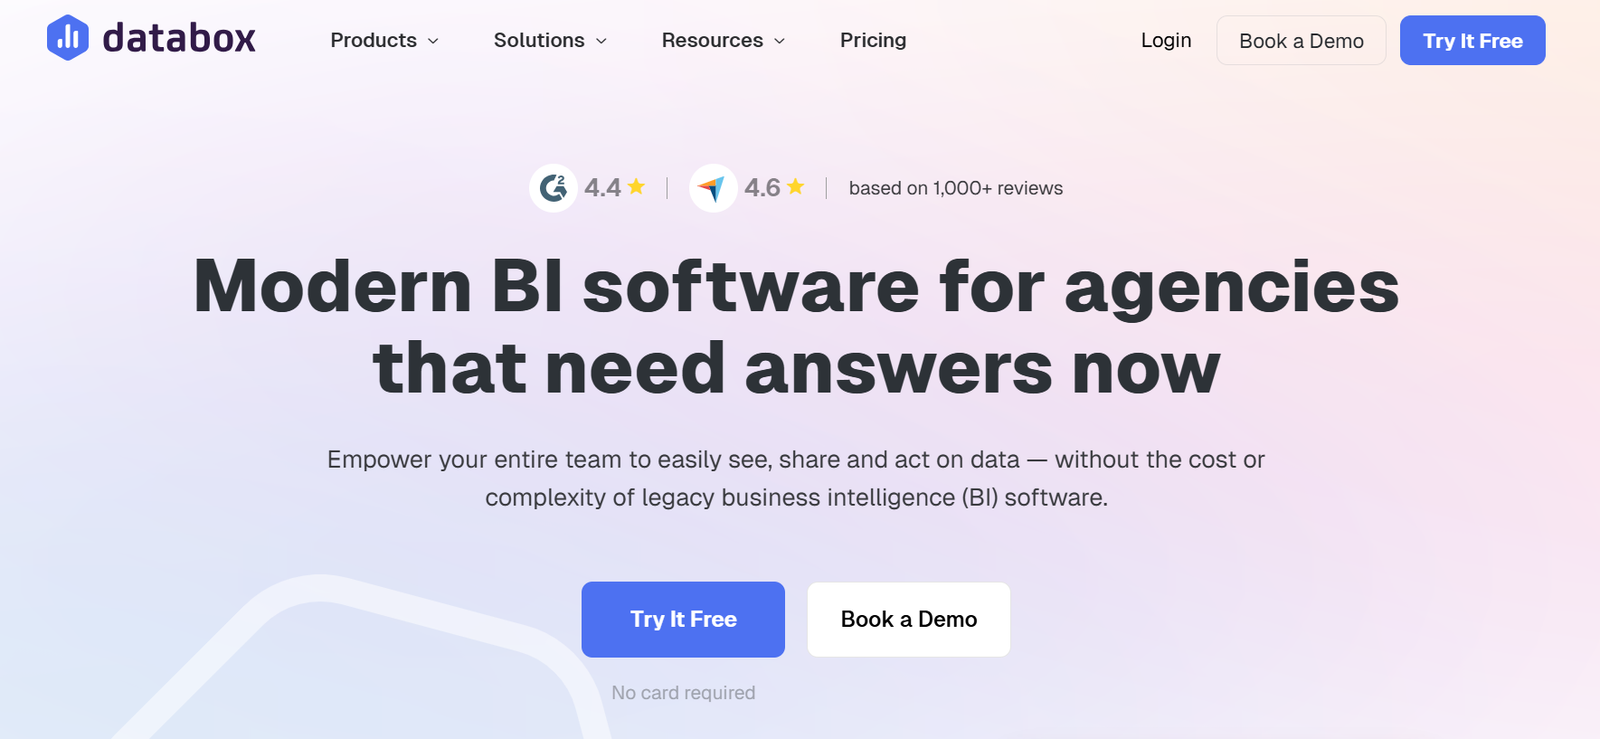
Databox stands out as a comprehensive business intelligence platform that combines powerful dashboard capabilities with growing AI features.
What impressed me most during testing was how seamlessly it unifies data from multiple sources into cohesive, actionable visualizations while making advanced analytics accessible to non-technical users.
4.6
OVERALL RATING
Key Pain Points Databox Solves
Highlight Features
Real-World Success: Weekly Report Case Study
“ We don’t spend any time at all on a weekly basis now doing any reporting. At 9 AM every single Monday, our clients automatically receive their report for the previous week, and at the end of each month, 90% of our monthly report is already pulled for us.”
Short, powerful, and straight from the video.
Shows exactly how much time automated reporting saves them every week and month.
You thinking of using something like this in your own blog or sales page? It hits hard when clients see real numbers like “90%” and “9 AM every Monday”
— Jack Edge, Managing Director at EDGEY, Databox User
User Experience
Databox offers one of the most intuitive interfaces I’ve encountered in business intelligence tools. The dashboard creation process is remarkably straightforward…connect your data sources, select metrics, and drag visualization components into place.
What impressed me during testing was how the platform automatically suggests appropriate visualization types based on the data selected. The AI performance summaries provide genuine value by explaining trends in plain language, making insights accessible even to team members without analytical backgrounds.
While there’s some initial learning curve for advanced features, most users can create valuable dashboards within their first session.
Pros and Cons
Integrations and Support
Databox excels in integration capabilities with 130+ pre-built connectors to popular business platforms, including analytics tools, CRMs, advertising platforms, and social media. Custom API connections are available for specialized needs.
Their support team receives consistently high ratings (4.7/5 on G2), with responsive chat support and comprehensive documentation. Higher-tier plans include dedicated support representatives who assist with dashboard creation and optimization.
The active user community provides additional resources through forums and template sharing.
Pricing
Databox’s pricing structure starts with the Professional plan at $159/month (billed annually) or $199/month (billed monthly), which includes 3 data sources, unlimited users, and basic features.
The Growth plan at $399/month adds more data sources and advanced AI capabilities. The Premium plan at $799/month includes priority support, advanced features, and additional data sources
Unify your business data into powerful dashboards!
Experience how Databox can transform your reporting and analytics with AI-powered insights.
4. Fabi.aI: Next-Generation Notebooks for Data Teams

Fabi.AI represents a significant evolution in data analysis environments, combining the power of SQL, Python, and AI in a reactive notebook interface.
What sets it apart is how seamlessly it bridges the gap between code-based analysis and natural language exploration, making it ideal for data teams that need both flexibility and accessibility.
4.5
OVERALL RATING
Key Pain Points Fabi.AI Solves
Highlight Features
Real-World Success: Fintech Data Analysis
A fintech startup with a small data team was struggling to keep up with analysis requests from product, marketing, and executive teams. Their existing workflow involved SQL queries in one tool, Python analysis in another, and manual dashboard creation in a third, creating bottlenecks and delays.
After implementing Fabi.ai, they unified their entire workflow in one platform. Data analysts could quickly prototype analyses using a combination of SQL, Python, and AI assistance, then convert successful explorations into automated dashboards with a few clicks.
The company reported a 70% reduction in time-to-insight, with non-technical team members now able to self-serve many analyses through the AI interface. This freed the data team to focus on more complex problems while democratizing data access across the organization.
User Experience
Fabi.AI offers a sleek, modern interface that will feel familiar to data professionals who have used notebooks like Jupyter, but with significant enhancements. The reactive cells respond instantly to changes, eliminating the need to run entire notebooks sequentially.
During testing, I was particularly impressed by the seamless integration between SQL, Python, and natural language…you can write a SQL query, process the results with Python, then ask the AI to explain patterns or generate visualizations, all within a single flow.
The learning curve is steeper than pure no-code tools, making it most suitable for data teams or analysts with some technical background, though the AI features help bridge the gap for less technical users.
Pros and Cons
Integrations and Support
Fabi.AI integrates with major data warehouses (Snowflake, BigQuery, Redshift), databases (PostgreSQL, MySQL), and file storage platforms (Google Sheets, S3). The platform also supports Python libraries for specialized analysis needs.
Their support team receives positive reviews (4.4/5 on G2), with responsive chat support and detailed documentation. Enterprise customers receive dedicated support channels and implementation assistance. The growing user community provides additional resources through forums and shared templates.
Pricing
Fabi.AI offers a free tier that allows users to explore basic functionality with limited storage and compute resources. The Builder plan starts at $39/month per user (billed annually) and includes essential features for individual analysts.
Team plans start at $89/month per user with additional collaboration features. Enterprise plans with unlimited resources, advanced security, and dedicated support are available by custom quote.
Elevate your data analysis with AI-powered notebooks!
Try Fabi.ai’s free tier and experience the future of data exploration and visualization.
5. Windsor.AI: The Ultimate Data Connector for Marketers
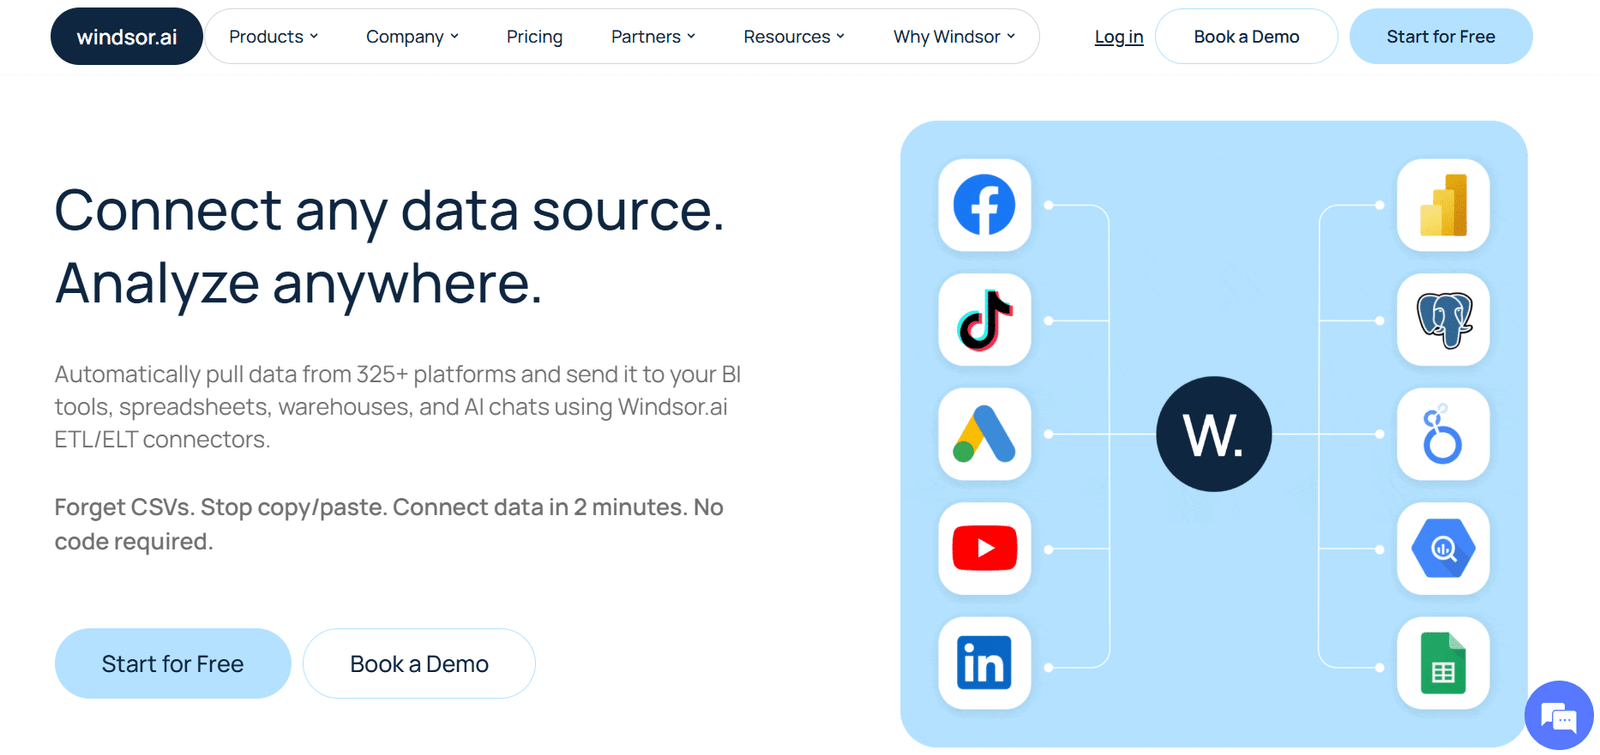
Windsor.AI takes a different approach from other tools on this list—rather than being a full analysis platform, it excels as a specialized data connector that helps marketers consolidate information from hundreds of sources.
This focused approach makes it exceptionally good at solving one of the biggest challenges in marketing analytics: data fragmentation.
4.5
OVERALL RATING
Key Pain Points Windsor.AI Solves
Highlight Features
Real-World Success: Agency Reporting Transformation
A mid-sized marketing agency managing campaigns across Google, Meta, LinkedIn, TikTok, and email platforms for 25+ clients was drowning in manual reporting work. Their team spent approximately 15 hours per client monthly downloading data from various platforms, cleaning it in spreadsheets, and creating reports.
After implementing Windsor.AI, they connected all client marketing channels to automatically pipe standardized data into Google Data Studio (now Looker Studio) dashboards. The agency eliminated 90% of manual data work, reducing reporting time to just 1-2 hours per client while delivering more comprehensive, real-time insights.
This efficiency allowed them to take on additional clients without expanding their team, increasing revenue by 35% while improving client satisfaction through more timely and accurate reporting.
User Experience
Windsor.AI offers a straightforward, purpose-built interface focused on connecting data sources and building pipelines. During testing, I found the connector setup process exceptionally user-friendly—most integrations require just a few clicks to authenticate and select the data you want to extract.
The platform automatically handles the complexities of API connections and data formatting. While Windsor doesn’t offer extensive visualization tools itself, it excels at preparing clean, structured data for analysis in your preferred BI tool.
This focused approach means there’s minimal learning curve for the core functionality, though some advanced transformation features require more familiarity with data concepts.
Pros and Cons
Integrations and Support
Windsor.AI’s primary strength is its extensive integration catalog, with 325+ source connectors covering virtually every marketing platform. For destinations, it connects to visualization tools (Power BI, Looker Studio, Tableau), spreadsheets (Google Sheets, Excel), and data warehouses (BigQuery, Snowflake).
Support quality receives good but not exceptional ratings (4.2/5 on G2), with email and chat support available.
Pricing
Windsor.AI offers a free trial to test the platform. Paid plans start with the Basic tier at $19/month, which includes essential connectors and daily updates.
The Professional plan at $99/month adds more connectors and hourly updates. The Business plan at $249/month includes advanced features and priority support. The Pro plan at $499/month offers the full feature set with unlimited connectors.
Eliminate marketing data silos!
Connect your marketing platforms and automate your data pipelines with Windsor.AI’s free trial.
6. SciSpace: AI-Powered Research and Academic Data Analysis

SciSpace stands apart from other tools on this list by focusing specifically on scientific and academic data analysis.
Rather than analyzing business metrics or spreadsheets, it helps researchers, students, and academics extract insights from scientific literature and research papers…a specialized but crucial form of data analysis for knowledge workers.
4.4
OVERALL RATING
Key Pain Points SciSpace Solves
Highlight Features
Real-World Success: Medical Research Efficiency
A medical research team studying emerging treatments for autoimmune disorders was struggling to keep pace with the rapidly expanding literature in their field. Team members spent 15+ hours weekly searching for relevant papers, extracting data points, and summarizing findings.
After implementing SciSpace, they created a specialized knowledge base of their research domain. The AI-powered search helped them discover relevant papers they had missed through traditional methods, while the data extraction tools automatically pulled clinical trial results and statistical data from PDFs into structured formats.
The team reported a 70% reduction in literature review time and identified three promising treatment approaches they had previously overlooked due to their presence in tangentially related research fields. This accelerated their research timeline by approximately six months.
User Experience
SciSpace offers a clean, intuitive interface that feels familiar to academic users while incorporating modern AI capabilities. During testing, I found the semantic search particularly impressive…it understands the conceptual meaning behind queries rather than just matching keywords, leading to more relevant results.
The PDF chat feature works remarkably well, allowing you to upload papers and ask specific questions about methodologies, findings, or implications. The platform feels designed by people who understand the research workflow, with thoughtful features like the ability to extract specific data tables or generate literature reviews with proper citations.
While primarily focused on text analysis rather than numerical data visualization, SciSpace excels at its specialized purpose.
Pros and Cons
Integrations and Support
SciSpace integrates with reference management tools like Zotero and Mendeley, as well as academic databases and institutional repositories. It also offers browser extensions for quick access while reading papers online.
Support quality receives good ratings (4.1/5 on G2), with email support available to all users and priority support for premium subscribers.
Pricing
SciSpace offers a generous free basic tier that includes limited searches, PDF uploads, and AI interactions—sufficient for casual users or students.
The Premium plan costs approximately $12/month (billed annually) or $20/month (billed monthly) and includes unlimited searches, more PDF uploads, and advanced features.
Accelerate your research with AI!
Discover relevant papers, extract data, and generate insights with SciSpace’s free tier.
7. Otio: AI-Powered Research and Knowledge Synthesis

Otio stands apart from other tools on this list by focusing on turning scattered research sources into organized insights and drafts.
Rather than crunching spreadsheets or business metrics, it helps researchers, students, and analysts collect, summarize, and analyze mixed content (PDFs, videos, articles, tweets)…. a key form of qualitative data analysis for knowledge work.
4.3
OVERALL RATING
Key Pain Points Otio Solves
Highlight Features
Real-World Success: Medical Research Efficiency
A grad student working on a literature-heavy project was overwhelmed by hundreds of papers and lecture videos. They spent 20+ hours weekly organizing notes and pulling key findings.
After implementing Otio, they imported their full library. The AI summaries gave quick overviews, the chat pulled comparisons (“What methods overlap in these papers?”), and the editor turned notes into cited drafts.
The student reported a 60% reduction in research-to-writing time and finished sections months ahead, spotting connections across sources they had missed before. This sped up their overall timeline significantly.
User Experience
Otio offers a clean, intuitive interface that feels made for research workflows. During testing, I found the auto-summaries and source…grounded chat particularly strong.
It pulls real citations and handles long videos smoothly. The editor keeps your voice while suggesting improvements. While more focused on synthesis and writing than heavy numerical charts, Otio excels at its purpose: bridging reading to usable insights.
Pros and Cons
Integrations and Support
Otio integrates with browser extensions for quick saves and pulls from YouTube, PDFs, links easily. It offers email support and solid documentation with tutorials for researchers. Support quality gets good ratings (4.1/5), with an active community in academic and writing circles.
Pricing
Otio offers a free tier that includes limited summaries, chats, and imports – enough for casual use or students. The Premium plan costs approximately $10/month (billed annually) or higher monthly, with unlimited access, advanced models, and more storage.
Extract Data Insights From Documents With Precision!
Collect sources, extract insights, and synthesize faster with Otio’s free tier.
8. MaxAI:Browser-Based AI Assistant for Quick Content and Data Insights

MaxAI stands apart from other tools on this list by living right in your browser as a Chrome extension. Rather than handling uploaded files or deep number crunching, it focuses on analyzing whatever you’re viewing online…webpages, PDFs, charts, videos – with fast chat explanations, summaries, and breakdowns.
It’s a handy pick for casual or on-the-fly data analysis when your “data” is on websites, dashboards, reports, or articles you stumble across.
4.3
OVERALL RATING
Key Pain Points Max AI Solves
Highlight Features
Real-World Success: Quick Dashboard Checks
A marketer reviewing online industry reports and competitor dashboards daily spent extra minutes manually figuring out charts or stats. With MaxAI, they added the extension and started asking the sidebar things like “Break down this revenue trend graph” or “Summarize key metrics from this PDF report.”
It gave clear explanations, spotted outliers, and let them follow up for more detail. Time per review dropped sharply, they caught insights faster for team updates, and turned vague data into actionable notes without extra tools. One catch: It flagged a weird spike in a public dataset they almost overlooked, helping refine a client strategy.
User Experience
MaxAI keeps things super clean and fast – install the extension, sidebar pops up on any page. It’s minimalist: highlight something, ask away, get answers quick with page context. In tests, chart explanations and PDF chats work smoothly for lighter files, and model switching helps when you need smarter depth.
Feels built for everyday browsing flows. Some users note credits burn fast on free tier or occasional glitches with complex pages, but the no-tab-switch convenience wins big for quick hits.
Pros and Cons
Integrations and Support
MaxAI works as a browser extension (mainly Chrome, compatible with others). It pulls from top models and includes built-in web search. Support gets okay ratings (around 3.9/5 from scattered reviews), with email options and basic docs. Community tips on Product Hunt or Chrome store help with common questions.
Pricing
MaxAI has a free tier with unlimited basic chat and limited advanced use – plenty to test page explanations or PDF summaries. Pro plans add smarter models, deeper analysis, more search sources, and extras like voice input (costs start around $12-30/month based on usage, often yearly discounts). It’s budget-friendly if browser work is your main thing – the time saved on quick insights adds up fast.
Boost your browsing with AI!
Explain data on any page, summarize reports, and get fast insights with MaxAI’s free tier. Sign up here!
9. PDF.AI:AI-Powered Chat for PDF Documents and Data Extraction

PDF.AI stands apart from other tools on this list by zeroing in on PDFs as your main data source. Instead of spreadsheets or broad research databases, it turns any PDF (reports, contracts, research papers, invoices, manuals) into something you can actually talk to – ask questions, pull out facts, get summaries, all with direct page references so you know exactly where the info came from.
4.2
OVERALL RATING
Key Pain Points PDF.AI Solves
Highlight Features
Real-World Success: Team Report Efficiency
A small finance team handling client reports and invoices weekly spent hours manually pulling totals, dates, and trends from PDFs. After PDF.AI, they uploaded files and asked things like “Extract all revenue figures and compare quarters” or “Summarize risks in these contracts.”
It delivered clean tables, cited sources, and quick overviews. Extraction time dropped 70-80%, they spotted billing errors they would’ve missed, and turned insights around faster for clients. One big win: Caught a recurring invoice mismatch across docs, saving real money on a project.
User Experience
PDF.AI keeps it dead simple…upload your PDF, start chatting in a clean box, answers pop up with highlights in the doc. The interface feels like a smarter reader: Fast, no clutter, good for big files (within limits). In real tests, source citations build trust, and specialized agents make answers sharper for finance or research docs.
Paid plans unlock multi-doc and better models. Some users mention credit limits bite quick on free or occasional layout hiccups on tricky PDFs, but the chat flow stays intuitive and useful.
Pros and Cons
Integrations and Support
PDF.AI offers a RESTful API for custom workflows and basic file uploads. It has solid docs for quick setup. Support gets okay ratings (around 3.9/5), with email help available. Community tips on places like Product Hunt help too, especially for extraction tricks.
Pricing
PDF.AI has a free tier with basic chat, limited questions/pages, plus free tools (parse/extract/split/merge/compress)… great for testing or light use.
Paid plans start around $17/month (Pro for more pages, unlimited questions, multi-doc, GPT-5 level) up to $37/month or higher for enterprise with API and security extras. Usage-based for heavy needs. Competitive if PDFs are your daily grind – the time saved on extraction and reading justifies it for pros or students.
Unlock your PDFs Data Analysis with AI!
Chat, extract data, summarize reports fast with PDF.AI’s free tier. Sign up here!
10. Krater AI: All-in-One AI Platform with Data Dan Persona for Analysis
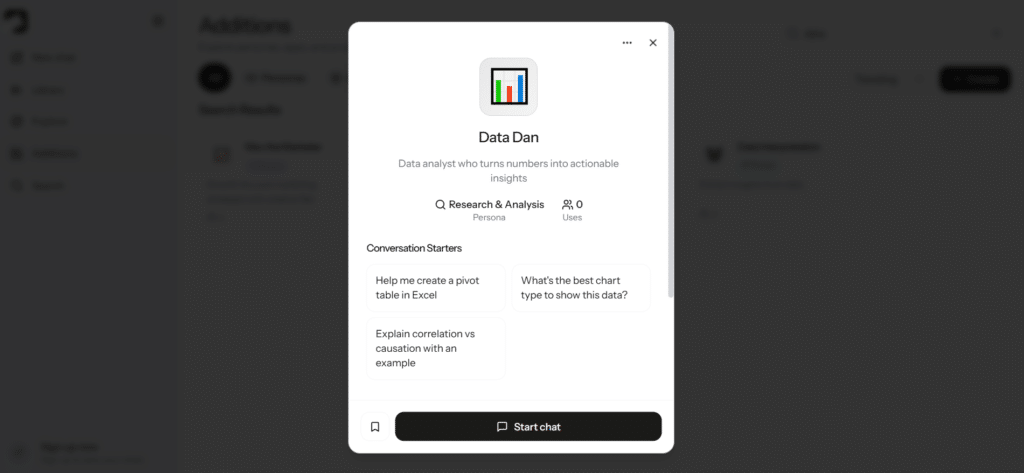
Krater AI stands apart from other tools on this list by being a multi-model AI superapp that bundles tons of top AIs (like GPT, Claude, Gemini, Grok) into one dashboard.
For data analysis, its Data Dan persona acts as a dedicated analyst you switch to…upload files, ask questions, get explanations, basic stats, trends, and even text-based visualizations described in detail. It’s not a full no-code powerhouse like Julius, but great if you want one spot for general AI work plus solid data chats when needed.
4.1
OVERALL RATING
Key Pain Points Krater AI Solves
Highlight Features
Real-World Success: Freelancer Client Quick Checks
A freelance analyst dealing with client spreadsheets and reports was tired of tab-hopping between AIs. They switched to Krater, used Data Dan for uploads (“Summarize growth rates” or “Spot outliers in this CSV”), and got clean explanations fast.
It cut daily tool-switching time by 30-45 minutes, helped catch a small pricing anomaly in one client’s data that could’ve cost them, and made sharing insights with clients quicker. Small fixes like that built trust and led to more repeat gigs.
User Experience
Krater AI feels clean and speedy – sidebar for personas, main chat area, easy file drops. Flipping to Data Dan shifts the vibe to analytical mode right away. Uploads handle small-to-medium files well, answers cite your data reliably, and model switching adds power when needed.
It’s made for mixed days (chat one minute, data the next). Some users say credits run out quick on free or support lags sometimes, but the all-in-one convenience keeps it practical for everyday use.
Pros and Cons
Integrations and Support
Krater offers API access and basic connections (Google Drive/Dropbox for files). It taps latest models and has decent docs for setup. Support lands around 3.8-4.0 from reviews – email/chat available, but responses can be slow. Community on Discord/Reddit shares persona tips and workflows.
Pricing
Krater has a free tier with daily credits and basic models – enough to test Data Dan on a few files. Paid plans start around $9/month (Personal for more credits, priority models) up to $39/month (Professional) or $399/month (Enterprise for teams with unlimited and custom stuff).
It’s one of the cheaper multi-AI options – great value if data is just part of your routine.
Get all your AI in one spot!
Try Data Dan for quick data chats and multi-model access with Krater AI’s free tier. Sign up here!
Key Features to Look For in an AI Data Analysis Tool
- Natural Language Querying: Data overload stops decisions dead. You need clear, fast answers. Pick a tool that lets you ask questions in plain English – like “Why did sales drop last month?” – and get actionable insights without writing code. Julius AI nails this with its chat-style interface that feels like talking to a real analyst. Powerdrill AI does it too, super quick for everyday questions.
- Intuitive User Interfaces: Not everyone is a data expert. Technical walls keep your team from using the tool. Go for clean, simple interfaces that feel easy for beginners and pros alike – so the whole team can actually get value. Powerdrill AI and Julius AI shine here with no-code, drag-and-drop vibes that non-tech folks love right away.
- Automated Data Preparation: Cleaning messy files eats hours. Choose tools that auto-handle cleaning, fixing errors, and transforming data. This lets you jump straight to insights instead of fighting spreadsheets. Powerdrill AI stands out big time with its smart auto-cleaning for Excel, CSV, even PDFs – it spots issues and fixes them fast.
- Comprehensive Integration Options: Scattered data sources give you only half the picture. Look for strong connections to Google Sheets, databases, CRMs, cloud storage – whatever you already use – so everything comes together in one place. Databox crushes this with 130+ connectors and easy syncs from marketing/sales tools.
- Automated Refresh Capabilities: Old reports become useless fast. The best tools auto-refresh data in real time or on a schedule. This keeps your dashboards and insights fresh without manual updates. Databox handles near real-time syncs (even 15-minute options) so your views stay current automatically.
- Advanced Pattern Recognition: Big patterns and surprises hide deep in the numbers. Prioritize machine learning that spots hidden trends, outliers, and connections you might never notice on your own. Powerdrill AI does deep trend spotting and anomaly detection really well, pulling out stuff you’d miss manually.
- AI-Generated Visualizations: Making good charts takes skill and time. Find tools that automatically pick and build the right graphs (bars, lines, heatmaps) from your question – instant visuals that look sharp and share easily. Julius AI generates charts on the fly from your questions, and Powerdrill AI takes it further with its Nano Banana Pro for pro slides and previews in seconds.
- Predictive Analytics Capabilities: Guessing the future is hard. Tools with forecasting use your past data to predict trends, risks, or growth…helping you plan ahead instead of always playing catch-up. Julius AI builds solid forecasts and trend predictions right in natural language chats – super handy for business planning.
Best Practices and Pro Tips for AI Data Analysis
After testing dozens of AI data analysis tools and implementing them for various organizations, I’ve gathered some practical advice that can help you maximize value while avoiding common pitfalls:
I learned this last point the hard way when implementing an AI analysis tool for a marketing team. The tool produced beautiful visualizations and insights, but team members lacked the context to understand statistical significance or correlation vs. causation.
We had to pause and conduct basic data literacy training before the tool delivered real value. The most sophisticated AI can’t replace fundamental understanding of what the numbers actually mean.
Remember that AI data analysis tools are evolving rapidly. What seems cutting-edge today may be standard tomorrow, so regularly reassess your toolset against emerging capabilities. The tools that best serve you will likely change as both your needs and the technology landscape evolve.
Key Takeaways
- AI is transforming data analysis by making powerful insights accessible to non-technical users through natural language interfaces and automated visualization.
- The best AI data analysis tool depends on your specific needs—Powerdrill AI excels for general business users, Julius AI for business-specific analysis, and specialized tools like SciSpace for academic research.
- Natural language querying has emerged as the most important feature for democratizing data access across organizations.
- Most tools offer free tiers or trials, making it possible to test capabilities before committing financially.
- Integration capabilities are crucial—look for tools that connect seamlessly with your existing data sources and business applications.
- AI assistance is powerful but works best when combined with human judgment and basic data literacy.
Conclusion
After extensive testing and research, Powerdrill AI emerges as the top AI data analysis tool for 2026, offering an unmatched combination of accessibility, power, and value. Its natural language interface removes technical barriers while delivering sophisticated insights, making it suitable for organizations of all sizes.
That said, the “best” tool ultimately depends on your specific needs. Are you a marketing team struggling with fragmented data sources? Windsor.AI might be your ideal solution. Need to analyze scientific literature? SciSpace could be the perfect fit. The good news is that with free tiers available for most options, you can experiment to find your perfect match.
What data challenges are holding your organization back, and which of these tools might help you overcome them?
The answers could unlock new levels of efficiency and insight that transform how you make decisions.
Ready to transform your approach to data?
Start with Powerdrill AI’s free tier today and experience the power of conversational data analysis—no technical skills required.