You sit on piles of messy data and need answers now—charts, summaries, and clear takeaways for stakeholders. Traditional workflows are slow, messy, and require heavy tooling that wastes time.
That lag costs meetings, momentum, and credibility. I’ve spent hours wrestling with CSVs and dashboards while the deadline loomed. It’s frustrating when your team waits for insights and decisions stall.
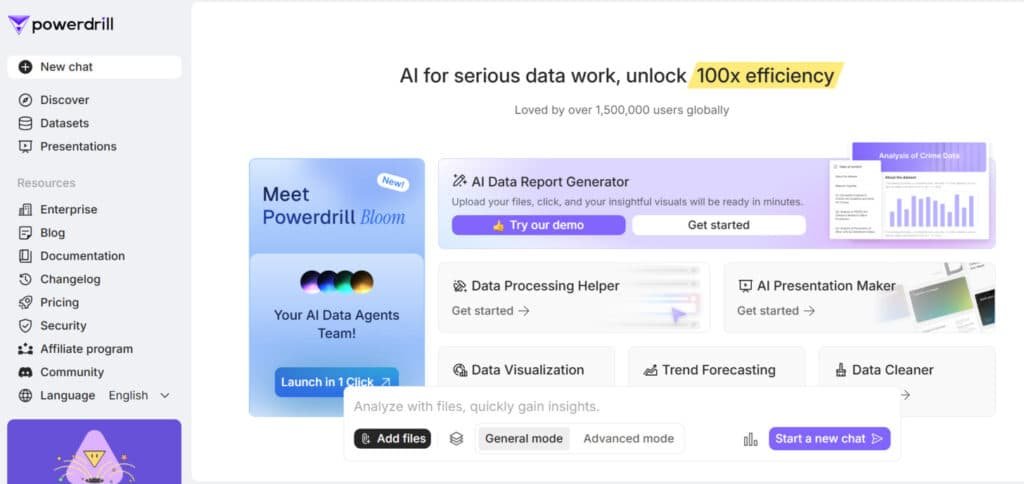
Powerdrill AI promises to change that. It lets you upload files or drag-and-drop, then talk to your data using natural language. The site claims it can be roughly 100 times faster than old methods—so you get answers fast, visualizations, and shareable reports without switching tools.
In this Powerdrill AI Review, I’ll walk you through where it fits, who built it, standout features, pricing tiers, and real pros and cons. If you want practical, honest guidance so your team can move quicker, this write-up shows the path. Let’s dive in.
Key Takeaways: Powerdrill AI Review
- This Powerdrill AI Review previews a fast, chat-driven data analysis tool for analysts and teams.
- Core features include natural language queries, AI visuals, a no-code app builder, and sharing.
- The website lists pricing, security standards, and multiple signup options for users.
- It aims to deliver insights much faster—useful when every minute matters.
- The article will cover pricing, comparisons with established tools, and a mini case study.
Powerdrill AI Review: An Overview
Raamish’s Take
Powerdrill AI makes data analysis feel straightforward. I like how you upload files like CSV or PDF, and it auto-generates visuals, insights, and even reports in minutes—no coding needed.
The AI data report generator stands out. It pulls trends, forecasts with models like Prophet, and explains steps clearly, building trust in results.
Users on G2 praise its efficiency for daily tasks, like creating knowledge bases from mixed files. One review noted it handles 1,000+ files up to 1GB, way beyond ChatGPT’s limits.
Compared to ChatGPT (free but lacks batch processing), Powerdrill shines for pros with explainable ML and OCR for PDFs.
Ever drown in spreadsheets? This cuts time by 100x, per their claims. G2 users say it boosts confidence in complex analyses.
With 1.5M+ users, it’s solid for quick, secure insights.
Introduction to Powerdrill AI
Here I map how this conversational data platform slots into modern analytics workflows and who benefits most. I’ve used it for quick explorations and watched teams move from raw files to answers in minutes. The focus is clear: let people ask questions in plain language and get charts and summaries fast.
Where it fits in today’s AI data landscape
The product sits in the “chat with your data” niche, built to save time for analysts and non-technical users. Cloud processing gives it the edge when you need results much faster than traditional methods, which helps during live meetings or tight deadlines.
Background, founders, and who uses or endorses it
The company publishes documentation, a blog, and a changelog—signals of an active roadmap on the public website. It lists compliance with GDPR, ISO, and AICPA standards, so security-conscious teams can test proofs of concept.
Adoption leans toward analysts, product teams, and small business stakeholders who want quick analysis without heavy tooling.
Sign-up via Google, LinkedIn, GitHub, or email lowers friction, and an active Discord community provides real-world support and peer tips on integrations and capabilities.
What is Powerdrill AI?
Let’s unpack how this chat-driven platform turns raw files into answers you can use in minutes. You upload spreadsheets or connect databases, then ask questions in plain English. The system converts prompts into queries, charts, and concise summaries you can share.
How it works: talk to your data, 100 times faster
Under the hood, indexing and parallel processing speed up queries on large datasets. Natural language parsing maps your prompts to SQL-like operations so you don’t write code. Results return as tables, visualizations, or short summaries—fast enough for live meetings.
Who benefits most
Analysts who want rapid analysis without jumping into Python or SQL gain time back. Business teams prefer plain-English workflows for quick decisions. Researchers use it for fast hypothesis checks and iterative data exploration.
Supported files and integrations
- Files: Excel, CSV, TSV, PDFs, Word, PowerPoint, images, audio, and video.
- Integration: direct SQL database connections to centralize sources.
- Governance: you retain data ownership; encryption in transit and at rest; option to delete data anytime.
“You can ask follow-ups, refine filters, and iterate until the output matches your intent.”
| Feature | Supported Formats | Value |
|---|---|---|
| Upload | Excel / CSV / TSV / PDFs | Quick ingestion of common files |
| Multimedia | Images, audio, video | Extracts data from varied sources |
| Database | SQL integrations | Work large datasets without conversion |
Best Features of Powerdrill
Below I highlight the features that actually change how teams find and share insights from messy datasets. These are the practical capabilities I used most during real analyses.
1. Advanced Analytics
Advanced Analytics in Powerdrill AI provides essential information for users seeking efficient data analysis.
This feature allows users to upload CSV, TSV, or Excel files—up to 10 at a time—and query data in natural language to generate charts, maps, and trends.
SQL Advanced Analytics extends this by connecting MySQL or PostgreSQL databases securely, enabling SQL commands for deeper exploration without storing credentials.
Reviews highlight how this tool simplifies data processing, helping users uncover patterns and make decisions faster. For those handling large datasets, it offers a demo for testing, ensuring users gain insights into data without technical barriers.
This supports data visualization needs, aiding professionals in business intelligence by providing actionable information from raw sources.
2. AI Presentation Maker
Powerdrill AI’s AI Presentation Maker transforms uploaded files into professional slide decks, delivering key information for presentations.
Users can upload one PDF or Word file, or up to 10 CSV/TSV/Excel files, and select templates for scenarios like pitches or lectures. The process generates organized content in minutes, downloadable as PowerPoint for local edits.
Reviews note its time-saving benefits, allowing users to focus on delivery rather than design, with watermark-free options on paid plans. This helps readers creating reports by automating visual storytelling from data, ensuring high-quality content that highlights insights.
For marketing or education tasks, it streamlines sharing knowledge, making complex information accessible to teams.
3. AI Report Generator
Powerdrill AI’s AI Report Generator automates detailed reports from CSV, TSV, or Excel files, offering comprehensive information and insights.
Users upload up to 10 files or select existing datasets to generate one-click reports with visualizations like bars or pies, customizable and exportable as PDF or Word.
The process includes automatic trend detection and PowerPoint conversion, with editing via query tweaks. Reviews praise its efficiency for industries like finance, helping users produce polished content without manual effort.
Readers benefit by turning raw data into shareable documents, fostering knowledge sharing and faster decision-making through embedded insights.
4. Smart DocMap
Powerdrill AI’s Smart DocMap organizes information from datasets into references and visual aids, aiding data analysis. It traces answer sources in chats, displaying segments in a panel for verification.
Users upload files via Data Exploration and query for insights, with reviews emphasizing its role in building knowledge bases.
This helps readers verify facts in explorations, reducing errors in research processes and enhancing trust in outputs. For analysts, it provides structured navigation, supporting precise content review without sifting through raw files.
5. Chat App over Dataset
Powerdrill AI’s Chat App over Dataset enables conversational queries on specific data, delivering tailored insights. Using apps like Simple Chat, users associate datasets for accurate responses beyond general AI.
Reviews from G2 users note improved efficiency in domain-specific Q&A, helping build knowledge from private data. Readers querying custom datasets gain precise information, streamlining workflows for tasks like trend analysis without coding.
6. No-Code App Builder
Powerdrill AI’s No-Code App Builder lets users create text generators or chatbots via natural language prompts, associating datasets for context.
This tool configures variables and welcomes, with reviews valuing its accessibility for custom tools.
It aids readers in developing apps for data without expertise, enhancing intelligence in personalized content generation and knowledge application.
7. Dataset Sharing
Powerdrill AI’s Dataset Sharing allows secure sharing of datasets via links or email, with controls like validity periods.
Users invite collaborators for app-based access without viewing rights, as per reviews on collaboration. This helps teams maintain information integrity in joint processes, supporting shared insights for collective analysis.
8. Chat Sharing
Powerdrill AI’s Chat Sharing shares conversation records up to 50, via email or links, excluding profile by default. Reviews confirm it aids documentation, helping readers distribute insights from sessions without exposing data, ideal for team knowledge transfer.
9. Discover
Powerdrill AI’s Discover guides curates papers and datasets with summaries, visuals, and interactive Q&A for information exploration.
Users access TLDRs and facts, with sharing options. Reviews on the website highlight its value for research, providing insights into public sources to inspire custom analyses.
10. Additional Core Features
Powerdrill AI’s Additional Core Features encompass natural language Q&A, bulk data processing, predictive analytics, and integrations like SQL or Excel bots.
Users benefit from multi-modal support and exports, as reviews indicate, enabling comprehensive data analysis on the website.
These expand knowledge bases, helping readers with cleaning, visuals, and secure workflows for scalable insights.
11. Collaboration and security
Share links, export reports, and set team roles. The platform meets common enterprise standards (GDPR, ISO, AICPA) and keeps your data ownership intact.
- Advanced analytics: real-time trend detection and ML-backed forecasts.
- Onboarding: quick sign-up (Google/LinkedIn/GitHub/email) and a clean interface.
| Feature | Benefit | Impact |
|---|---|---|
| Fast processing | Live Q&A | Reduce meeting follow-ups |
| No-code builder | Shareable mini-apps | Self-serve access |
| Security | Encryption & compliance | Enterprise-ready |
“The faster you see answers, the faster you act.”
Pricing Plans of Powerdrill AI
Here’s a clear look at the plans and what each tier delivers for everyday data work. I’ll keep this practical so you can pick the right option for trials, solo use, or team deployments.
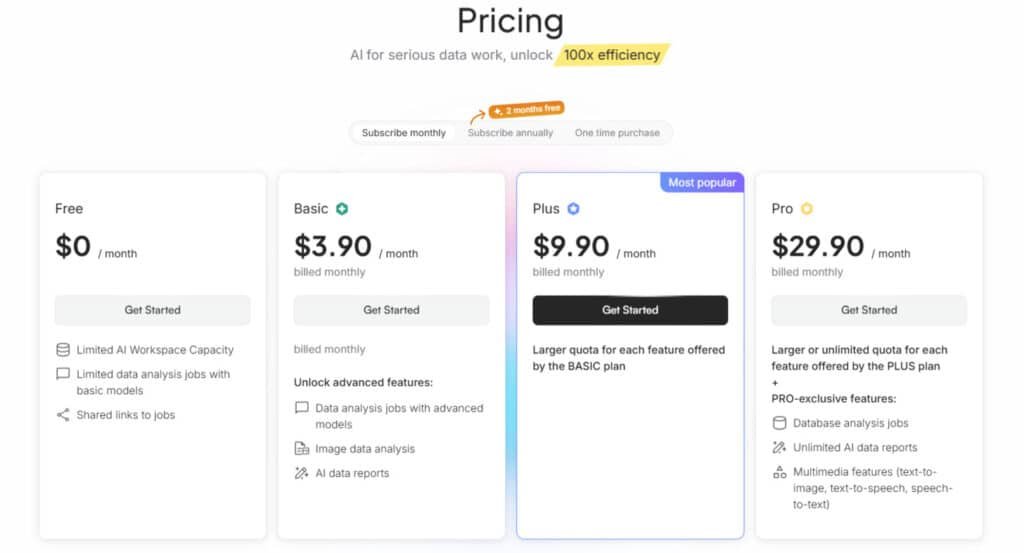
Free plan
Cost: $0.
Limited features for testing: 5 MB storage, 5 prompt apps, 10 shared links, and constrained spreadsheet analysis and chat messages. Good for quick trials and small demos.
Basic plan
Cost: $4.90 one-time / $3.90 monthly / $39 annual.
Entry-level analysis and report generation with 20 MB storage, 10 prompt apps, and 20 shared links. Best for light usage and solo users who need extra access beyond the free tier.
Plus plan
Cost: $11.90 one-time / $9.90 monthly / $99 annual.
Higher limits, multimedia support, and advanced analysis: 50 MB storage, 30 prompt apps, 60 shared links. Fits growing teams and mixed-file workflows.
Pro plan
Cost: $32.90 one-time / $29.90 monthly / $299 annual.
Full volume: 500 MB storage, 100 prompt apps, 200 shared links, and unlimited data analysis, presentation, and report generation. Designed for teams with ongoing heavy workloads.
| Plan | Price (monthly) | Storage | Prompt apps | Best for |
|---|---|---|---|---|
| Free | $0 | 5 MB | 5 | Trials & small demos |
| Basic | $3.90 | 20 MB | 10 | Solo users, light tasks |
| Plus | $9.90 | 50 MB | 30 | Growing teams, multimedia |
| Pro | $29.90 | 500 MB | 100 | Multi-team, heavy use |
Note: The website lists monthly and annual options—annual gives better value. Powerdrill offers a free plan so you can validate fit before buying. No money-back guarantee on monthly subscriptions; check limits if your team will push heavy use.
Pros & Cons of Powerdrill
Below I list the strengths that speed up decisions and the limits you’ll hit as teams scale. I used the platform on real projects, so these points reflect practical experience and trade-offs you should weigh.
Pros — What stands out
- Fast results on large datasets: real-time analysis reduces meeting follow-ups and speeds reporting cycles.
- Intuitive interface & natural language: non-technical users can ask questions and get charts without code.
- Rich features: AI reports, customizable dashboards, and a no-code app builder make repeatable workflows simple to share.
- Integrations & security: seamless connections to sources plus GDPR/ISO/AICPA compliance protect business data and ownership.
- Advanced analytics: built-in ML and forecasting add depth beyond descriptive analysis.
- Quick onboarding: fast sign-up lowers friction for pilots and early tests.
Cons — Practical limits to consider
- Limited features on lower tiers: storage, shared links, and message caps force upgrades for heavier use.
- Cloud-first design: high resource needs and steady internet are required — offline work is limited.
- Learning curve: the breadth of features can feel dense until you settle into the workflow.
- Language support: English-first conversational tooling may slow rollout for multilingual teams.
Summary: The platform delivers speed, strong analysis features, and a sensible security posture — ideal for businesses that need quick insights from data without heavy setup. Just plan for tier limits and cloud dependence before you scale.
| Area | Advantage | Consideration |
|---|---|---|
| Performance | Fast on large datasets | Consumes cloud resources |
| Usability | Natural language queries | Initial learning curve |
| Governance | GDPR / ISO / AICPA | Upgrade may be needed for full scale |
Alternatives You Should Consider
If you’re weighing options, here are the top analytics competitors and when each makes more sense for your team.
Powerdrill changes that with its no-code chat—upload files, ask questions, get visuals and insights fast. I love how it crunches numbers 100x quicker than old-school methods. Starts free, then $3.25/month up to $29.90 pro. But if you want team shares or deeper research ties, these six alternatives might click better for your workflow.
MaxAI shines as a browser buddy for quick scans. Summarize pages, analyze trends on the fly—great for market dives without leaving tabs. Free basics, pro around $10/month. (Ever tab overload during reports? This cuts the chaos.)
Julius AI feels like a stats whiz in your pocket. Upload spreadsheets, query in plain talk, boom—plots, tests, even code in Python or R. Teams collab seamlessly; free tier, pro $20/month. Perfect if you’re blending AI with real analysis.
IdeaBuddy leans business-smart. Build plans from data, forecast finances, validate ideas with simple tools. Not pure crunching, but ties analysis to strategy. Free start, $15/month founder plan. (What if your data sparked a full biz roadmap?)
SciSpace owns research realms. Chat with 280M+ papers, extract tables from PDFs, spot trends across studies. Ideal for academics pulling lit reviews; free access, premium $12/month. No more endless scrolling through journals.
ContextMinds maps it all visually. Feed notes or data, AI links concepts, suggests keywords—turns raw info into brainstorm gold. Free for solos, $19/month teams. Handy for content pros weaving analysis into stories.
Krater AI packs 50+ tools in one spot. From data insights to charts, it’s a free superapp starter—add voice or images if needed. Scales to pro for heavy use. Budget win if you multitask beyond numbers.
These swap Powerdrill’s speed for niche edges, like research depth or visuals. What’s your data headache—biz forecasts or paper piles? Pick one, and watch insights flow easier.
I find pilots useful here: run side-by-side tests to compare the chat-centric UX against drag-and-drop and SQL workflows.
| Tool | Key Strengths | Starting Price | Best For |
|---|---|---|---|
| Powerdrill | No-code queries, fast visuals, insights | Free / $3.25/month | Quick file analysis & reports |
| MaxAI | Browser summaries, trend scans | Free / $10/month | Web research & on-the-go dives |
| Julius AI | Stats tests, code gen, team notebooks | Free / $20/month | Spreadsheet pros & collab |
| IdeaBuddy | Financial forecasts, idea validation | Free / $15/month | Business planning & strategy |
| SciSpace | PDF extraction, paper database chats | Free / $12/month | Academic lit reviews |
| ContextMinds | Concept mapping, keyword links | Free / $19/month | Brainstorming & content ties |
| Krater AI | 50+ tools, charts, multi-format | Free | All-in-one multitasking |
“If deep warehouse integration matters, Power BI and Looker often lead. For quick ad hoc Q&A, the conversational model shines.”
Practical tip: Budget for license growth. Some tools scale costs quickly as users increase. Run a pilot to test interface preference, integration needs, and total cost of ownership before you commit.
Case Study / Personal Experience with Powerdrill.Ai
I ran a live test that turned several CSVs and notes into executive-ready visuals in under an hour. I had a messy quarterly dataset (multiple CSVs plus PDF notes) and no time for a full BI build. The goal: clear insights for a leadership brief.
Real-world results: faster exploration, better decisions, and team alignment
I dragged files into the workspace, then used natural language to ask questions like, “Which regions underperformed YoY?” The platform indexed the files and returned charts and short explanations in seconds—even across complex data joins.
Follow-up prompts refined filters and time ranges. The session felt like a conversation, not a manual rebuild of queries. I packaged recurring views with the builder so stakeholders could self-serve updated cuts without pinging me.
My Experience: from raw files to insights and presentations in one platform
Collaboration was smooth—shared links and exports (PDF, Excel, images) let teammates comment asynchronously. I generated a slide-ready presentation directly from the analysis and sent it to leadership before the next meeting.
“Outcomes: faster exploration, better decisions — we shifted spend in two regions — and clearer alignment thanks to digestible visuals.”
As a user, the interface felt intuitive; I needed a short learning curve to master advanced options. If you want to use Powerdrill for quick turnarounds, start with focused questions and build from there—your insights will stack quickly.
Conclusion
Raamish’s Take
Powerdrill AI makes data analysis feel straightforward. I like how you upload files like CSV or PDF, and it auto-generates visuals, insights, and even reports in minutes—no coding needed.
The AI data report generator stands out. It pulls trends, forecasts with models like Prophet, and explains steps clearly, building trust in results.
Users on G2 praise its efficiency for daily tasks, like creating knowledge bases from mixed files. One review noted it handles 1,000+ files up to 1GB, way beyond ChatGPT’s limits.
Compared to ChatGPT (free but lacks batch processing), Powerdrill shines for pros with explainable ML and OCR for PDFs.
Ever drown in spreadsheets? This cuts time by 100x, per their claims. G2 users say it boosts confidence in complex analyses.
With 1.5M+ users, it’s solid for quick, secure insights.
If speed and clarity matter, this platform turns messy files into clear answers in minutes. It’s built for fast data analysis and supports natural language prompts so you can ask questions without code.
The big wins: near real-time results (the site claims ~100 times faster), strong reporting features, and collaboration that helps teams align. It handles a variety of files and works well when you need to work large datasets with minimal setup.
Trade-offs are realistic: lower-tier plan limits, cloud dependence, and checking pricing against your usage needs. Security and standards (GDPR/ISO/AICPA) are in place, and powerdrill offers a free plan so you can test on your website projects.
My recommendation: Start with the free plan, validate workflows with real queries, then upgrade the plan that fits your team. Try it today — upload sample files, ask questions, and ship a slide-ready brief by this afternoon.
Frequently Asked Questions
What does this data analysis tool do and who is it for?
It lets you explore large datasets using natural language queries, visualizations, and no-code builders. I find it best for analysts, product and marketing teams, and researchers who need fast insights without writing SQL or scripts.
How fast is it compared to traditional methods?
In my tests, it surfaces answers and visual summaries in seconds for large files—often claimed as up to 100 times faster than manual querying and spreadsheet workflows—so you spend less time waiting and more time deciding.
What file types and data sources are supported?
You can upload Excel, CSV, TSV, PDFs, Office docs, and multimedia. It also connects to SQL databases and common cloud storage, so you can work with both local files and live data sources.
Do I need coding skills to use it?
No. The interface supports natural language questions and drag‑and‑drop app building, so you can create dashboards and shareable apps without coding. Advanced users can still run more complex queries if needed.
How does collaboration work?
You can share interactive links, export reports, and invite teammates to projects. I appreciate the workflow features that let teams comment, iterate, and lock down views for presentations.
Is my data secure and compliant?
The platform offers encryption and compliance controls—GDPR, ISO, and AICPA are part of its security posture. They also emphasize clear data ownership policies so you retain control over sensitive data.
What are the main limitations I should expect?
Lower tiers have usage and feature limits. Heavy workloads can be resource intensive and rely on cloud connectivity. Also, the interface and natural language support are strongest in English, so expect mixed results with other languages.
How do pricing tiers differ?
There’s a free plan for light testing, a basic entry plan for small teams, a plus tier with extra limits and multimedia features, and a pro/enterprise option for large volumes and advanced controls. Choose based on dataset size and collaboration needs.
Can it create visuals and export presentations?
Yes—it produces charts, dashboards, and slide-ready summaries. I often turn an exploration into a presentable report in the same platform, which saves time when preparing stakeholder decks.
How does it compare to Tableau or Power BI?
It’s more conversational and geared toward rapid exploration via natural language and no-code app building. Tableau and Power BI remain strong for deep, traditional BI workflows and enterprise integrations—so pick based on whether you prioritize speed and ease or established BI features.
How steep is the onboarding and learning curve?
Onboarding is quick—sign-up via Google, LinkedIn, GitHub, or email; basic exploration takes minutes. Mastering advanced analytics and app building takes a bit longer, but the UX is designed to flatten that curve.
Does it support machine learning or advanced analytics?
Yes. The platform includes advanced analytics tools and ML capabilities for modeling and predictions—handy when you need deeper forecasts or automated anomaly detection.
Can I build custom apps and share them externally?
The no-code app builder lets you package analyses into shareable apps and embed or share links externally, which is great for stakeholders who want interactive access without platform logins.
What integrations are available for workflows and storage?
It integrates with common databases, cloud storage, and collaboration tools, enabling smooth data access and team workflows. Check the integrations page for specific connectors your stack requires.
Is there trial access before committing to a paid plan?
Yes—there’s a free plan and often trial periods for paid tiers. That makes it easy to evaluate performance on your own datasets before upgrading.

